Category: Technical Indicators
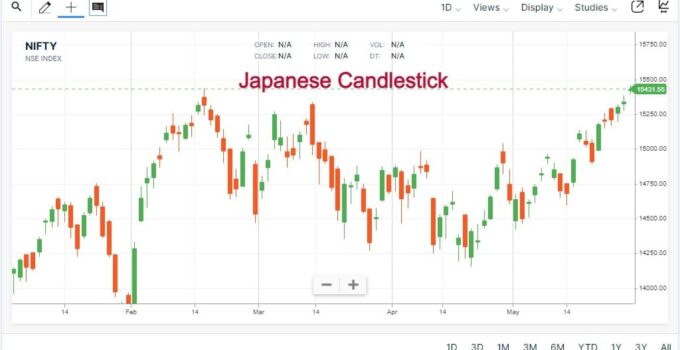
The candlestick charting was invented in Japan. Hence it is also known as Japanese Candle. The use of candlestick charts is easy and simple compared to all other chart …
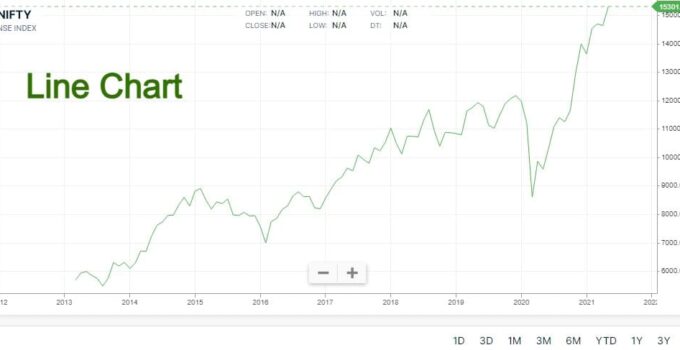
The Line chart is a way to depict the four readings of the scrip/commodity i.e. the open or high or low or close of a single day in a …
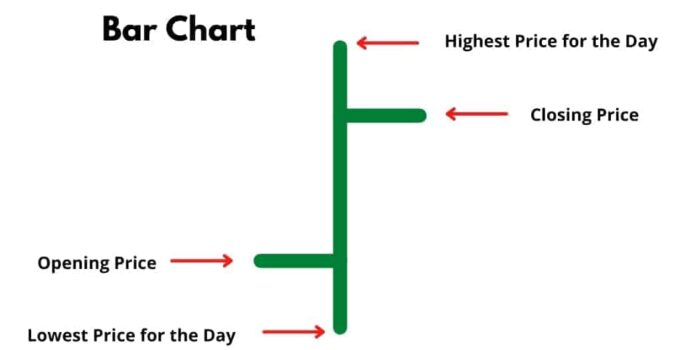
Bar chart shows entire day trading movements. More useful as compare to line charts because it shows all four (Open, High, Low, Close) price of the day. How to …
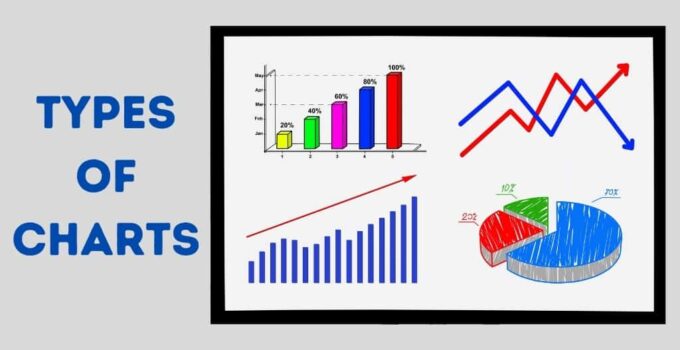
There are different types of charts available for technical analysis. Below are the most commonly used charts for stock study. Line Chart Bar Chart Japanese Candlestick Line Chart Line …
Technical analysis has become popular over the past several years, as more and more people believe that the historical performance of a stock is a strong indication of future …
