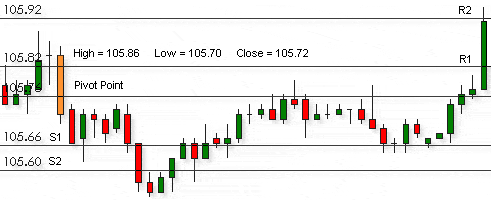
A pivot point is becoming more popular in traders working to find support & resistance level based on previous day’s Open, High, low & Close. There are various types to calculate pivot point. With using PPyou can find trading opportunities in each trading days. It is the most usable Indicators among all indicators.
How to calculate Pivot Point?
Formula:
- Pivot Point (PP) = (Day’s High Price + Day’s Close + Day’s Close)/3
- Support-1 (S1) = (PP * 2) – Day’s High
- Support-2 S2) = PP- (Day’s High – Day’s Low)
- Support-3 (S3) = Day’s Low – 2 *(Day’s High – PP)
- Resistance-1 (R1) = (PP * 2) – Day’s Low
- Resistance-2 (R2) = PP+ ( Day’s High – Day’s Low)
- Resistance-3 (R3) = Day’s High + 2 *( PP- Day’s Low)
How to Use Pivot Point in day trading?
Lets Study Below Chart for how to use PP.
Support & Resistance.
The main key is support & resistance.
Support:
- In Pivot Point support values is a price which is very important level for buying the company stocks. Suppose particular company share price is going down & hits its support price than usually its start to rebound & begin to move up again.
- Support price is the price which gives you an indication to buy that particular shares. If price moves again down through a support price, you can use next support price as another indication of buying.
Resistance:
- In Pivot Point Resistance exactly works opposite to support.
- Resistance price use for selling indication in Trading.
More Useful Article


