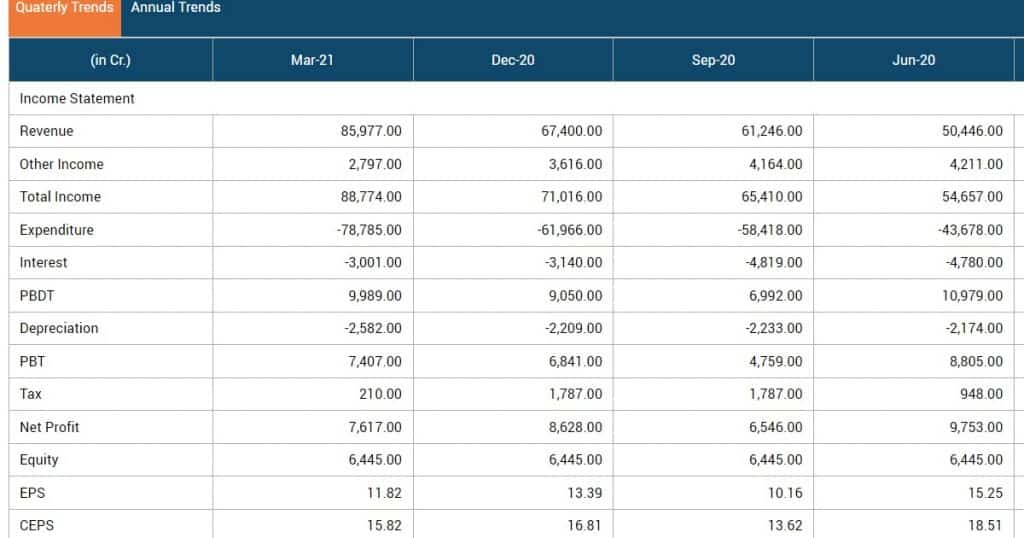
It is very important to understand the financial audit of a company before investing in any company. There are lots of key terms used in financial reports to easily understanding of Monthly, Quarterly, Six month & yearly results.
Most Common Key Terms Used in Financial Reports
There are so many key terms used. Let us understand the meaning of some most useful & important key terms.

Price To Book Value (P/B)
Price to book value is the ratio of the price of a stock to the book value per share of the company. It shows how much premium investors are willing to pay for the underlying net assets of the company.
Price To Earnings (P/E)
Price to earnings (P/E) The price-to-earnings ratio, or the P/E ratio, is simply the ratio of the price of a stock to its earnings per share. It shows in multiples how much investors are willing to pay for the earnings. The thumb rule of valuing a stock is that a high-growth stock will have a high P/E ratio, while a value stock will have a relatively lower P/E ratio.
Earnings Per Share (EPS)
Earnings per share (EPS) Earnings per share, or EPS, is calculated by dividing the company’s net profit with the total number of outstanding shares.
EPS Growth
Growth of the EPS over a specified time period – trailing 12 months (TTM), a quarter or five years. Quarterly comparisons are on a year-on-year basis. For five years, the figures are annualized.
Price-Earnings To Growth (PEG)
This ratio demonstrates how high a price we are paying for the growth that we are purchasing. It is the ratio of price to earnings to the EPS growth of the stock. In all our analyses, we have taken five-year historic EPS growth.
Earnings Yield
Earnings yield Earnings before interest and taxes (EBIT) divided by enterprise value. Enterprise value is market cap added to total debt and less cash and equivalents.
Dividend Per Share
Dividend per share Total dividend declared during the year divided by the total number of outstanding shares.
Net Sales
Net sales This is simply the income that a company derives by selling the goods and services that it produces. The downside of taking sales as an indicator of growth is that it may not be matched by a similarly scintillating bottom-line (net profit) performance. A company may be earning revenue at a high rate. But if it is doing so by incurring a very high cost, the bottom line may not grow in proportion to the growth in the top line (sales).
Interest-Coverage Ratio (ICR)
Interest-coverage ratio (ICR) This indicator is generally used to gauge whether a company has the ability to service its debt. The interest-coverage ratio is calculated as the ratio of operating profit to interest outgo. A company with an ICR of more than two implies that it can service more than twice its current interest charges.
Debt-equity Ratio
The debt-equity ratio is calculated as the ratio of total outstanding borrowings of the company to its total equity capital. It essentially tells us which companies use excessive leverage to achieve growth. Conventionally, the debt-equity ratio of less than two is considered safe.
Return On Equity (ROE)
Return on equity (ROE) This is measured by taking profit after tax as a percentage of net worth of the company. It indicates how efficiently the company has been able to utilize investors’ money.
Stock Return
Stock return is calculated by taking the percentage change in the price of the stock adjusted for bonus or split.
Dividend Yield
Dividend yield This is defined as the percentage of the dividend paid per share to the current market price of the stock. Since the denominator in this ratio is the market price, a stock’s dividend yield changes every day.
Dividend-Payout Ratio
Dividend-payout ratio This is the total dividend paid to the shareholders as a percentage of net profit.
Altman Z-Score
Altman Z-Score Developed by Edward Altman of New York University, the Z-Score predicts a company’s financial distress or the possibility of its going bankruptcy within two years. A Z-Score of more than three is desirable.
Modified C-Score
Modified C-Score It tells the probability of financial manipulations. In order to develop it, we have modified James Montier’s C-Score. A C-Score of less than four is desirable.
Piotroski F-Score
Piotroski F-Score Developed by Joseph Piotroski, the F-Score highlights financial performance as compared to that in the previous year. It thus points out to the current outperformer Growth Value in terms of profitability and financial improvement. An F-Score of seven or above is good.
Stock Style
Stock style it indicates the style of the stock. It is derived from a combination of the stock’s valuation growth or value and its market capitalisation – large, mid and small. For example, on the night we have shown the stock style of a large cap growth stock.
Take a Look


