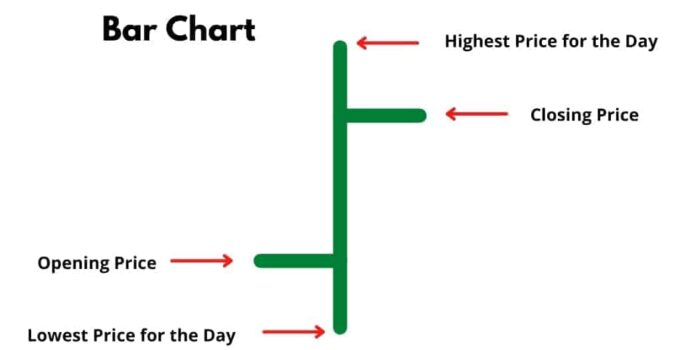
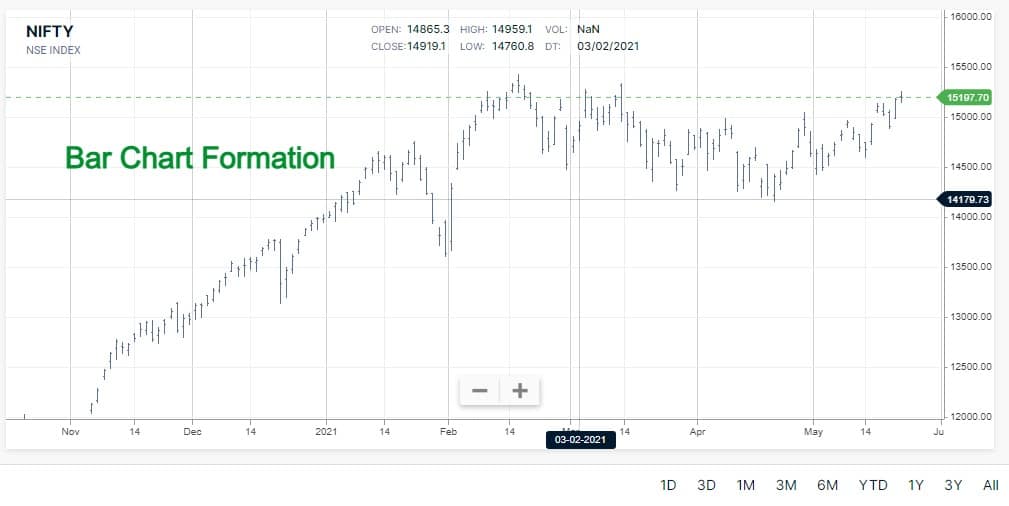
Bar chart shows entire day trading movements. More useful as compare to line charts because it shows all four (Open, High, Low, Close) price of the day.
How to Read a Bar Chart for Day Trading?
Very popular in technical analysis. Lets Understand the bar chart.
- Top of vertical line shows the highest price of the day (Highest Price Traded During the Day).
- Bottom of the vertical line shows the lowest price of the day(Lowest Price Traded During the Day)
- Horizontal line just above the lowest price is opening price of the day.
- Horizontal line just below the highest price is closing price of the day.
Constructing of a Bar Chart
The bar chart is a way to plot the four readings of the scrip/commodity i.e. the open, high, low, close of a single day in a very compact form and is easy to read and analyses the data. Comprises of number of bars plotted on a graph.
- A price scale is assigned to the vertical Y axis.
- A time scale (hourly, daily, weekly, etc) is assigned to horizontal X axis.
- For each period the opening, high, low and closing prices are plotted.
- The slash on the left denotes the opening price and the one on the right denotes the closing price.
Conclusion
Charts are the foundation of technical analysis. Very simple and useful. With the help of this chart traders can predict the movement of price. Candlestick charts are most comely use for technical analysis.
Take A look
